Covid-19 Analytics
A modified SEIR model of the Covid-19 outbreak in India, run across six lockdown strategies to find the one that minimises deaths without shutting the economy indefinitely.
- Year
- 2020
- Where
- Pandit Deendayal Petroleum University, with Dr Krunal Mehta
- My role
- Modelling and analysis
Abstract
This document shows the prediction of the nCovid-19 outbreak in India in different scenarios, modelled using a computational SEIR model modified for nCovid-19, and suggests approaches for resolving the epidemic in an optimised way — keeping deaths at a minimum while avoiding pausing the economy beyond a viable extent.
Keywords: coronavirus, India, prediction, infection, Covid-19.
1. Introduction
“Pandemic is not a word to use lightly or carelessly. It is a word that, if misused, can cause unreasonable fear, or unjustified acceptance that the fight is over, leading to unnecessary suffering and death.”
So said Dr Tedros on 11 March, after declaring SARS-CoV-2 a pandemic. This infectious disease has brought the whole world to an unfortunate halt, right before which the world was already heading towards a recession. India reported its first case on 30 January 2020, about 61 days after the first case was reported in China in December 2019 [1]. The first few cases were Indian students returning to their homeland from the epicentre, at that time, in Wuhan. Most of these chains of transmission were traced accurately and slashed away until 4 March 2020, when 22 new cases tested positive and it started to become slightly difficult for the official authorities to control local transmission.
For modelling the spread of disease in India, a modified SEIR model was used with a few assumptions, as the research on this virus is very limited. A lot of different input parameters were used, as different government strategies, to analyse the number of deaths with respect to bed and intensive care unit availability in India, and also the economic impact of all of the strategies.
2. Model (modified SEIR)
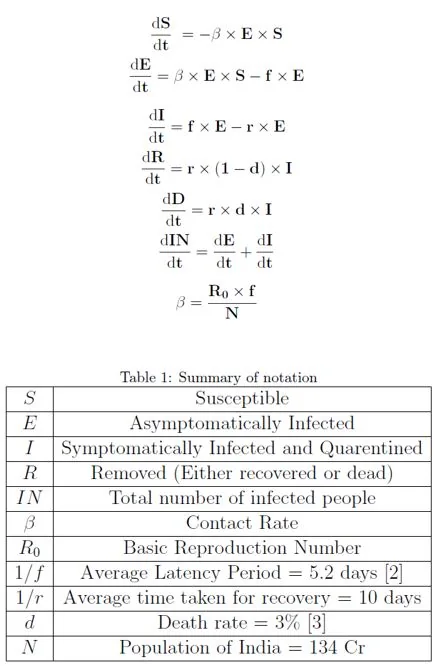
A modified Susceptible-Exposed-Infected-Reduced model has been used, where Exposed is modified to be Asymptomatically Infected, Infected is modified to be Symptomatically Infected, and Reduced includes Recovered or Dead. A few assumptions were used, as follows.
- Only asymptomatically infected people can spread the disease, which means symptomatic patients are quarantined instantly.
- The population of the country remains constant — no births, and no deaths due to reasons other than coronavirus. This is done to keep the model simple; with the population that India has, this assumption wouldn’t alter the results by a significant amount.
- The whole population is assumed to be susceptible to the disease, as we have seen people of all ages testing positive for this virus.
- A person once cured can’t be susceptible to the disease. This is true for most viruses but it hasn’t been scientifically proven for coronavirus yet, hence it is an assumption.
- All infected people will show symptoms after an average of 5.2 days. Even though we know some people get through this without any symptoms, we don’t have enough statistical data for that to be incorporated in the model.
- To estimate deaths, it is assumed that India would have enough beds for every ill person at that instant — which probably wouldn’t be the case in harsh scenarios, so the prediction would be quite a lot lower than reality.
3. R₀ value for India
R₀, the basic reproduction number, is used to describe how infectious a disease is. It can depend on several factors, which are either disease dependent or location dependent. This was estimated to be 2.6 in Wuhan, China [4]. Wuhan and India have some similarities, but the temperature varies by a lot between the two places, and according to one study the R₀ value goes down by 0.0287 per degree increase in temperature and decreases by 0.00876 per unit increase in relative humidity [5]. Hence R₀ was found to be 1.77162.

4. Scenarios
The initial condition for all scenarios is taken as the data published on 3 March: IC = [N−39, 36, 3, 0, 0, 39], the sequence being [S, E, I, R, D, IN]. Since it takes 5.2 days for a case to be identified, we select a day five days before 3 March — 27 February 2020 — and consider the data published on 3 March as the data for 27 February. Hence the x-axis on all graphs counts days starting from 27 February.
Certain assumptions are made for estimating the R₀ value during the lockdown. For the initial 10 days of lockdown, R₀ is reduced to 50% of its original value, as for the first 10 days it was not as effective and the government officials weren’t as strict. For the next 11 days R₀ is brought down to 20% of its original value, as by then almost all migrants had been provided with a place to stay and the police had become stricter. The reason this is still kept at 20% is that people still interact with their neighbours and go out to buy essentials.
Scenario I — no lockdown
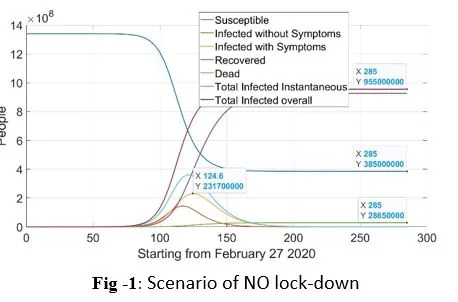
If India was allowed to run as usual for the entirety of this pandemic, the graph below shows what the condition of India would have been.
About 28.65 million people would die — and this is assuming India would be able to arrange 231.7 million hospital beds at a peak on day 124 after 27 February, which is highly unlikely. Only about 385 million people would go without getting infected, which is just 28.7% of the population.
This would result in a huge economic impact compared to any other scenario, as the amount of money that would go into testing, creating hospitals, PPE and so on would be incredibly high. This scenario is obviously highly unlikely, yet it was modelled to create a baseline for comparison.
Scenario II — no lockdown after the initial 21 days
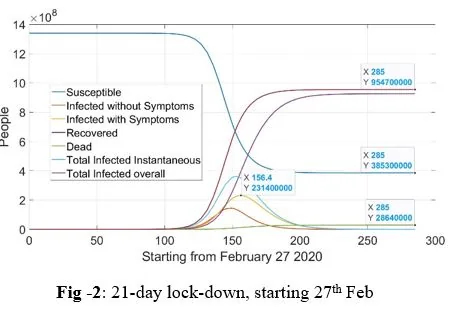
Lockdown: 25 March to 14 April.
Here a very similar situation to the first scenario repeats, as any cases left after the lockdown is over will again start infecting others. It can be inferred from the graph that the peak of cases in hospital is delayed by about 32 days, which can go a long way in helping the nation prepare in terms of medical equipment. Even then this scenario, just like the first, is highly unlikely, as it results in about 28.64 million deaths and the nation would obviously be shut down again when cases start to increase.
Scenario III — 21 days, a two-day break, then 18 stricter days
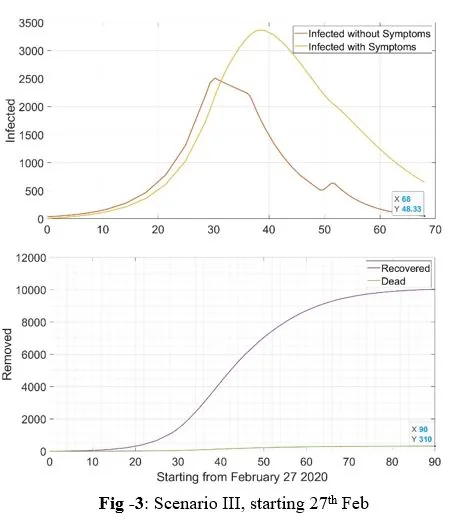
Lockdown 1: 25 March to 14 April. Relaxation: 15 to 16 April. Lockdown 2: 16 April to 3 May.
In this scenario, after the initial 21-day lockdown, people stuck away from home can be allowed to return (hotspots stay shut), and the two-day period would also be enough for people to buy groceries and prepare for the next 18 days of extremely strict lockdown, where going out only in case of a medical emergency is entertained. The army might be required to bring about a lockdown this strict. For the final 18-day lockdown the R₀ value is taken as one tenth of the initial value.
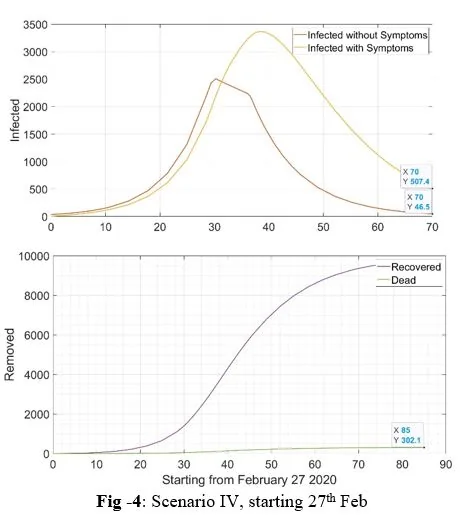
Scenario IV — 43 continuous days
Lockdown: 25 March to 6 May.
A lockdown as strict as the one in the previous scenario might not be possible. In that case a continuous lockdown for 43 days is required to eliminate the virus.
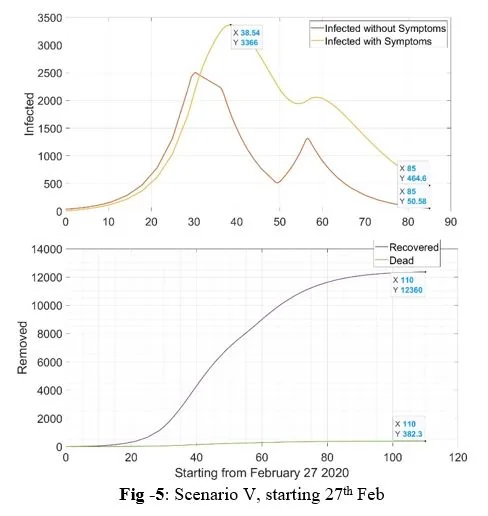
Scenario V — 21 days, a week off, then 32 more days
Lockdown 1: 25 March to 14 April. Relaxation: 15 to 21 April. Lockdown 2: 22 April to 23 May.
In a scenario where the government thinks the spread is under control and lifts the lockdown after 21 days, by the end of one week the cases would have piled up again, as there would still be some active cases in the community going unnoticed. Because of that increase, a similar lockdown for another 32 days would be necessary to get the disease completely under control for businesses to open.
Lifting the lockdown after the initial 21 days is an extremely risky move. It might happen that all cases get caught during the first 21 days, but it is highly unlikely, and India would observe a lot more deaths and a lot more days under lockdown for taking that risk.
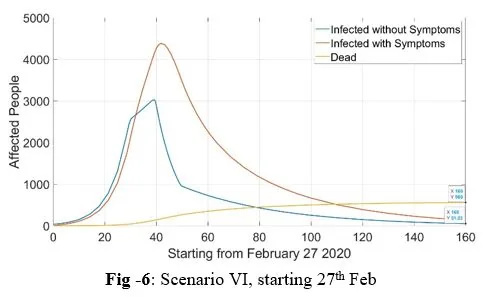
Scenario VI — partial lockdown for workers with more than two rooms at home
According to 2011 Indian census data, 402,234,724 out of 1,028,737,436 people are workers — about 39.09% of the population. Only people with more than one room at home are allowed to work (59%, according to the same census), so whoever in the house goes to work lives in one separate room away from the whole family, and proper sanitisation of the house is constantly done so they don’t get infected. That is the key.
The R₀ value for workers in the above category is assumed as 1.77162 — India’s normal. For the rest of the population, since the lockdown is still active, it is assumed to be 30% of normal, which is 1.5 times the average taken during the 21-day lockdown. This is because not all families would be careful enough to avoid getting infected through the working people at home. Hence R₀ for this scenario works out to 0.59 × 0.39 × 1.77162 + (1 − 0.59 × 0.39) × 0.30 × 1.77162 = 0.862.
Even with such strong assumptions, the partial lockdown would have to continue for another 110–115 days after the initial 21-day lockdown, and that does not seem very viable, since most people below the poverty line have one-room houses and wouldn’t be allowed to work. The minimum two-room condition had to be taken because without it the R₀ value would be above 1, and to contain any epidemic R₀ needs to be brought below 1.
5. Results and discussion
Scenarios I and II are there to show how a single 21-day lockdown, or no lockdown, will not be very useful — except that in Scenario II the government gets some extra days to strengthen its healthcare system, which would still be of no use when the number of cases is in the order of hundreds of millions. Something like Scenario I was followed by the UK and the Netherlands; this strategy is called herd immunity. It was followed because they initially had a lot of confidence in their healthcare system, but the plan was soon changed and a lockdown was enforced in the UK.
In Scenario III, about 310 people would have died — 0.001% of the first two scenarios. This looks like an optimum solution, with the fewest days under lockdown (39) among the viable scenarios (III, IV and V), which would obviously be quite beneficial to the economy.
In Scenario IV, about 302 deaths are observed, the minimum among all viable scenarios, and India would be under lockdown for 43 days.
In Scenario V, the cases rise during the relaxed week and about 382 people would die, with India under lockdown for a total of about 53 days.
6. Conclusion
This model is based on a lot of assumptions, and at the end of the day these predictions are just based on maths — they can’t predict the actions of one single human being, and we all know even one person can ruin the efforts of many when it comes to an epidemic. India has faced a lot of such instances, where people have made mistakes which caused a sudden rise in cases. The severity of the model might also be different from the one assumed here, so the model needs to be kept updated, and the number of days mentioned in all the scenarios would change accordingly. Based on the assumptions taken here, Scenarios III and IV suit India’s economy and healthcare system the most.
References
- Adam J Kucharski, Timothy W Russell, Charlie Diamond, Yang Liu, John Edmunds, Sebastian Funk, Rosalind M Eggo, Fiona Sun, Mark Jit, James D Munday, et al. Early dynamics of transmission and control of Covid-19: a mathematical modelling study. The Lancet Infectious Diseases, 2020.
- Stephen A Lauer, Kyra H Grantz, Qifang Bi, Forrest K Jones, Qulu Zheng, Hannah R Meredith, Andrew S Azman, Nicholas G Reich, and Justin Lessler. The incubation period of coronavirus disease 2019 (Covid-19) from publicly reported confirmed cases: estimation and application. Annals of Internal Medicine, 2020.
- Anthony Hauser, Michel J Counotte, Charles C Margossian, Garyfallos Konstantinoudis, Nicola Low, Christian L Althaus, and Julien Riou. Estimation of SARS-CoV-2 mortality during the early stages of an epidemic: a modelling study in Hubei, China and northern Italy. medRxiv, 2020.
- Qun Li, Xuhua Guan, Peng Wu, Xiaoye Wang, Lei Zhou, Yeqing Tong, Ruiqi Ren, Kathy SM Leung, Eric HY Lau, Jessica Y Wong, et al. Early transmission dynamics in Wuhan, China, of novel coronavirus–infected pneumonia. New England Journal of Medicine, 2020.
- Jingyuan Wang, Ke Tang, Kai Feng, and Weifeng Lv. High temperature and high humidity reduce the transmission of Covid-19. Available at SSRN 3551767, 2020.